Nifty50 opened the session on March 2 on a tepid note and witnessed selling pressure throughout the session to close the weekly expiry around the day's lows. However, the index had rebounded strongly on Wednesday, post forming, the red candles for consecutive nine sessions in a row. The reversal was witnessed after hitting the potential reversal zone (PRZ) of the AB=CD Harmonic pattern which stands around the 17,300-17,250 zone.
Hence, going ahead till the index manages to protect 17,200 mark, index is expected to perceive an oversold bounce towards 17,630, followed by 17,800.
Failure to hold 17,200 would invalidate the Harmonic pattern and shall signal the continuation of the down-move. In this case, the decline shall extend towards 17,030-16,880 levels.
Here are three buy calls for next 2-3 week:
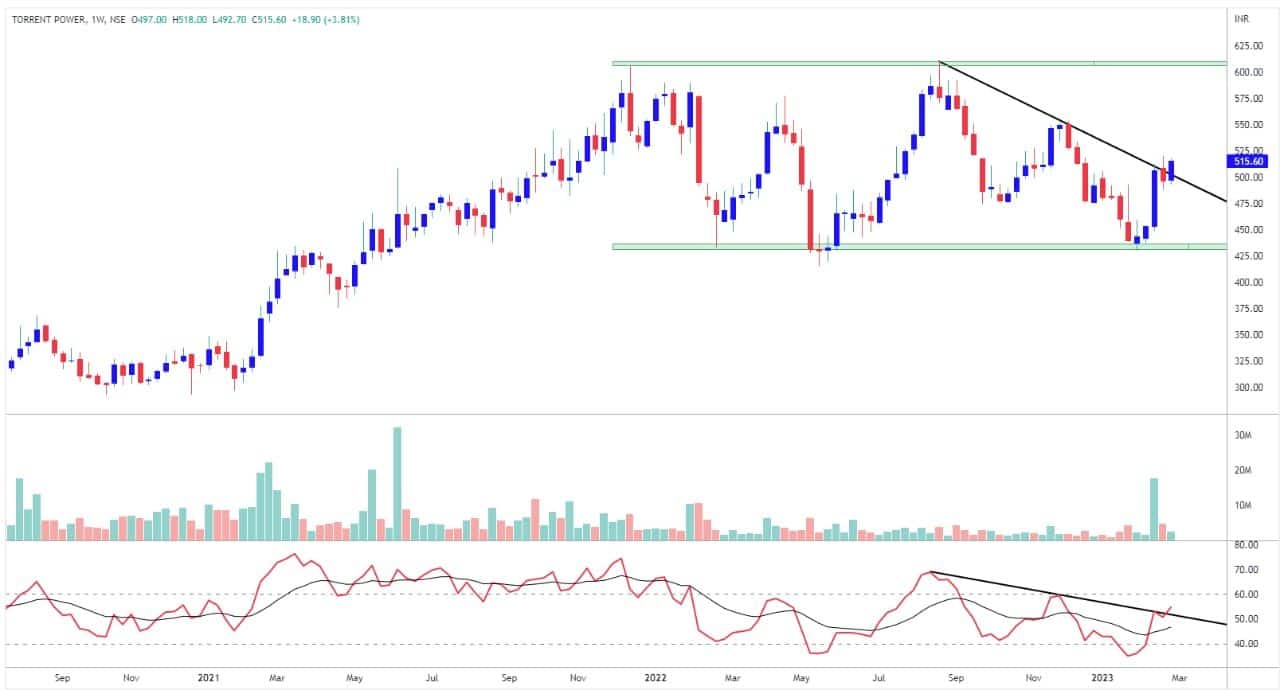
Torrent Power: Buy | LTP: Rs 516 | Stop-Loss: Rs 490 | Target: Rs 565 | Return: 10 percent
The stock saw a tremendous rally in 2021, where price rallied from Rs 296 to Rs 606, which is an outstanding move. Post hitting an all-time high of Rs 606, price turned into a hibernation mode, trading in a broad range of Rs 600-430 levels.
This year, in late January, price rebounded higher finding support around lower band of the mentioned range with supportive momentum and volumes. Price trading above all key moving averages (20, 50, 100, 200-day) highlights strength in trend.
This week price resolved higher breaking the downsloping resistance trendline indicates bullish momentum to continue ahead. RSI (relative strength index) has surpassed above 50 levels and has registered a breakout from resistance trendline compliments bullish bias on price.
Asian Paints: Buy | LTP: Rs 2,834 | Stop-Loss: Rs 2,700 | Target: Rs 3,100 | Return: 9 percent
Since August 2022, prices have remained under pressure and plummeted nearly 25 percent. After the round of selloff, now prices are showing some sign of bullish price action with favourable risk to reward opportunity.
On the higher timeframe chart, stock has dropped to the confluence of support which includes rising trendline, AB=CD Harmonic pattern and 88.6 percent retracement line of its prior advance from Rs 2,560 to Rs 3,583.
RSI has dropped to historical support readings. Furthermore, relative strength line against Nifty50 have rebounded higher from the lower end of the range indicates improvement in trend strength.

UltraTech Cement: Buy | LTP: Rs 7,289 | Stop-Loss: Rs 7,038 | Target: Rs 7,800 | Return: 7 percent
In November 2022, the price registered a breakout from Inverse Head & Shoulder price pattern which is bullish reversal signal and indicates bullish bias in price for medium term trend.
Post breakout price seen trading in defined range above the neckline of pattern with positive bias. The Future ichimoku cloud is bullish and wide.
Prices have been reversing taking support at flat cloud line. Also, price trading above base & conversion line denotes momentum and strength in price.

Disclaimer: The views and investment tips expressed by investment experts on Moneycontrol.com are their own and not those of the website or its management. Moneycontrol.com advises users to check with certified experts before taking any investment decisions.

Discover the latest Business News, Sensex, and Nifty updates. Obtain Personal Finance insights, tax queries, and expert opinions on Moneycontrol or download the Moneycontrol App to stay updated!
Find the best of Al News in one place, specially curated for you every weekend.
Stay on top of the latest tech trends and biggest startup news.